Step 1: Open Observability
- Log in to Bud AI Foundry.
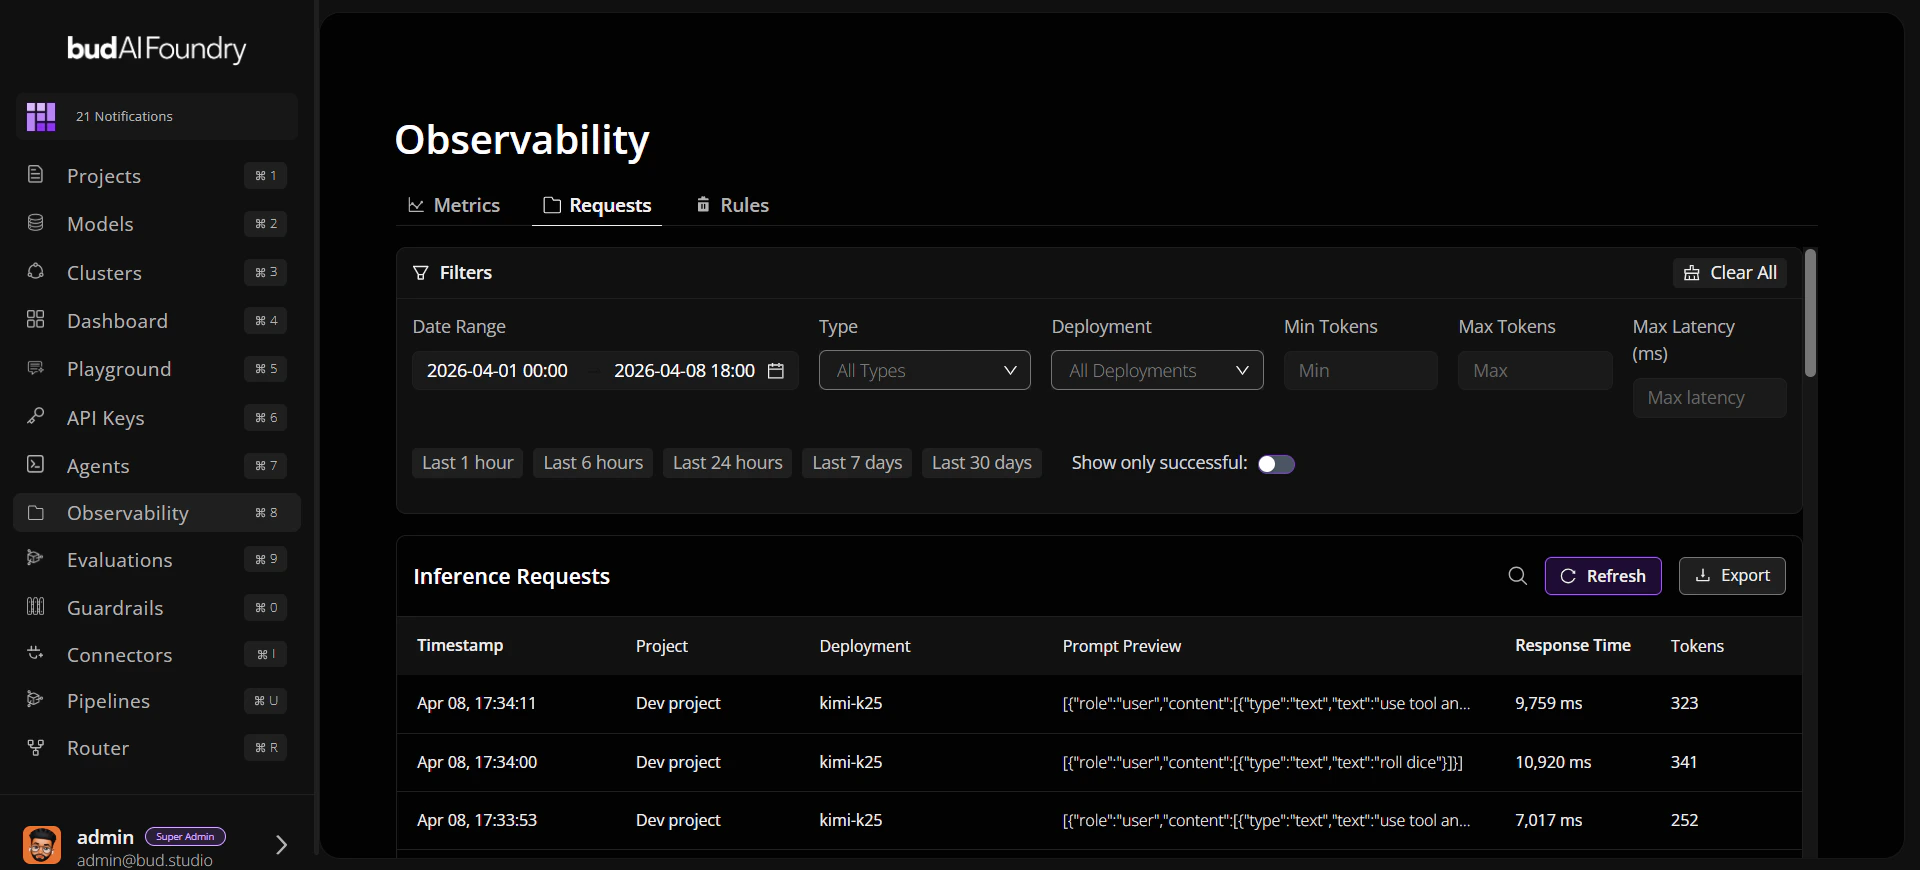
- Click Observability in the left navigation.
- Confirm you can access Metrics, Requests, and Rules tabs.
Step 2: Set Time Window
- Choose a preset such as Last 1 hour or Last 24 hours.
- Use the custom date picker when you need precise comparison windows.
Step 3: Review Metrics
- On Metrics, pivot the view by Model, Deployment, Project, or User.
- Inspect KPI cards for request count, success/failure, latency, and token usage.
- Check charts for spikes in latency, TTFT, or request volume.
Step 4: Investigate Requests
- Switch to Requests.
- Apply search and filters (project, endpoint type, latency, tokens).
- Sort by response time to identify outliers.
- Open a request for full metadata and payload details.
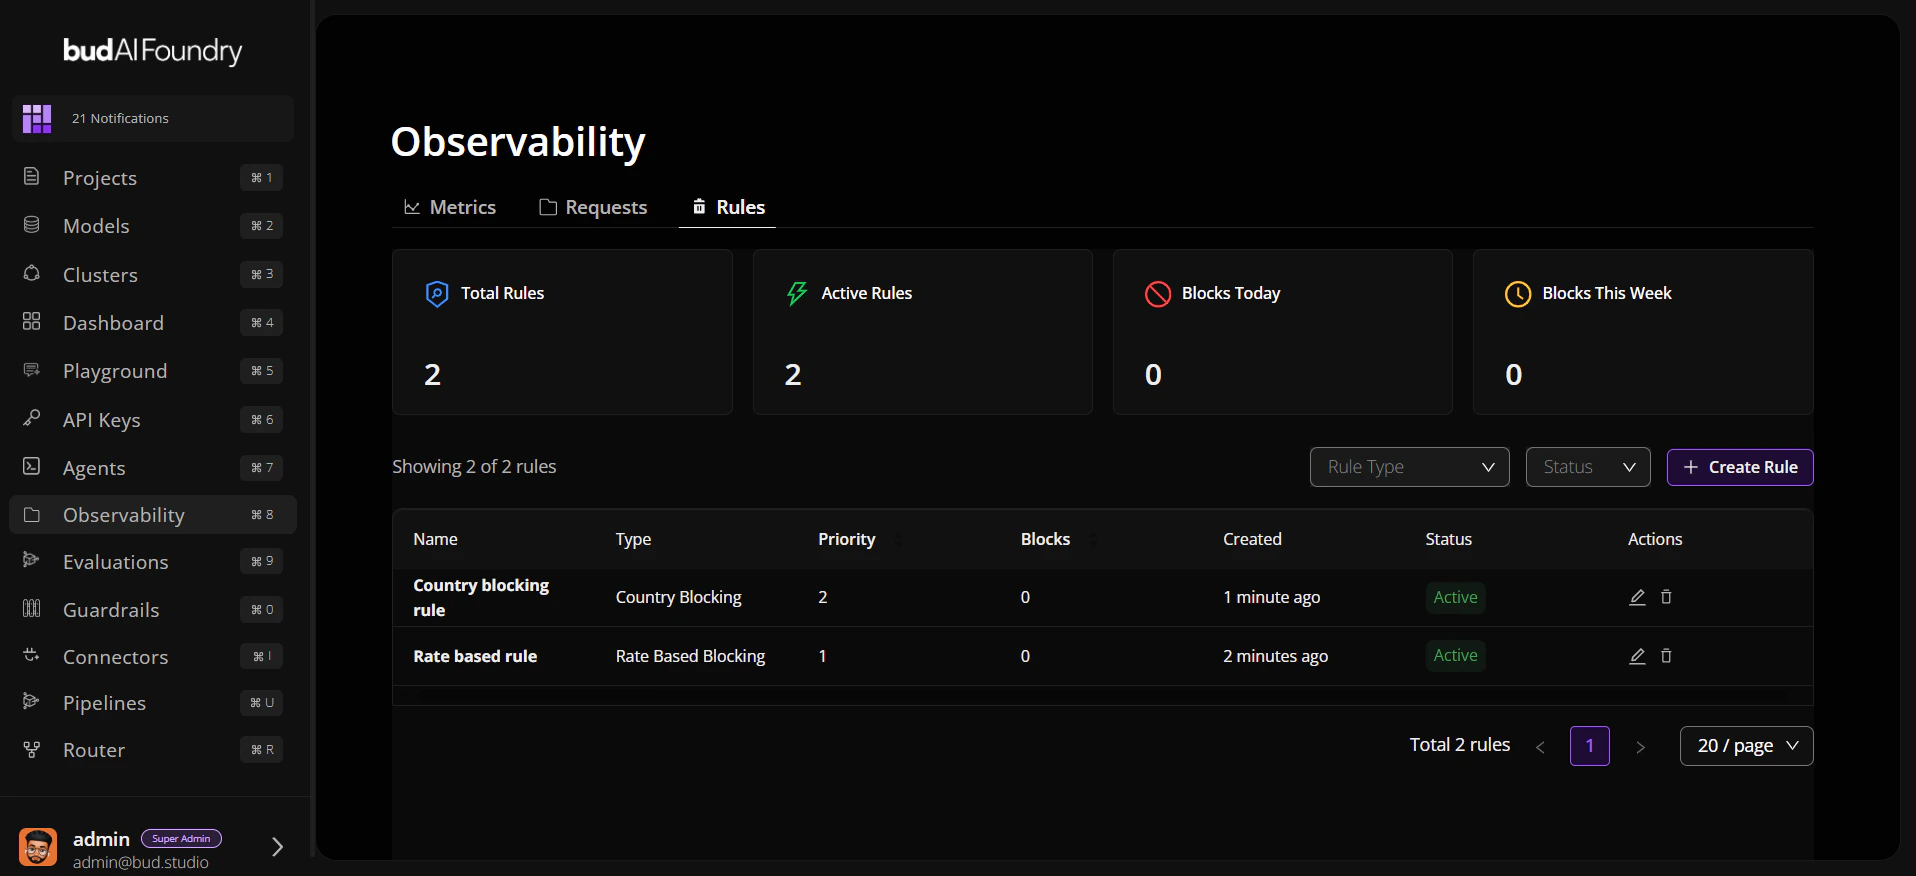
Step 5: Validate Rules
- Open Rules.
- Filter by type and status.
- Verify active rules align with current traffic behavior.
Next Steps
Concepts
Learn the data model and investigation patterns
Troubleshooting
Resolve common observability issues