Overview
Bud AI Foundry Observability provides a single workspace for understanding inference behavior across models, deployments, projects, and users. It combines metrics, request-level diagnostics, and enforcement rules so teams can monitor service health and respond quickly.Key Features
Inference-Centric Metrics Track requests, latency, token usage, TTFT, and throughput over configurable time windows. Request-Level Debugging Drill into individual requests with metadata, payload details, and trace-ready identifiers. Rules & Blocking Controls Manage IP, country, user-agent, and rate-based rules with active/inactive state and lifecycle actions. Consistent Filtering Apply time range, text search, and scoped filters to narrow investigations quickly.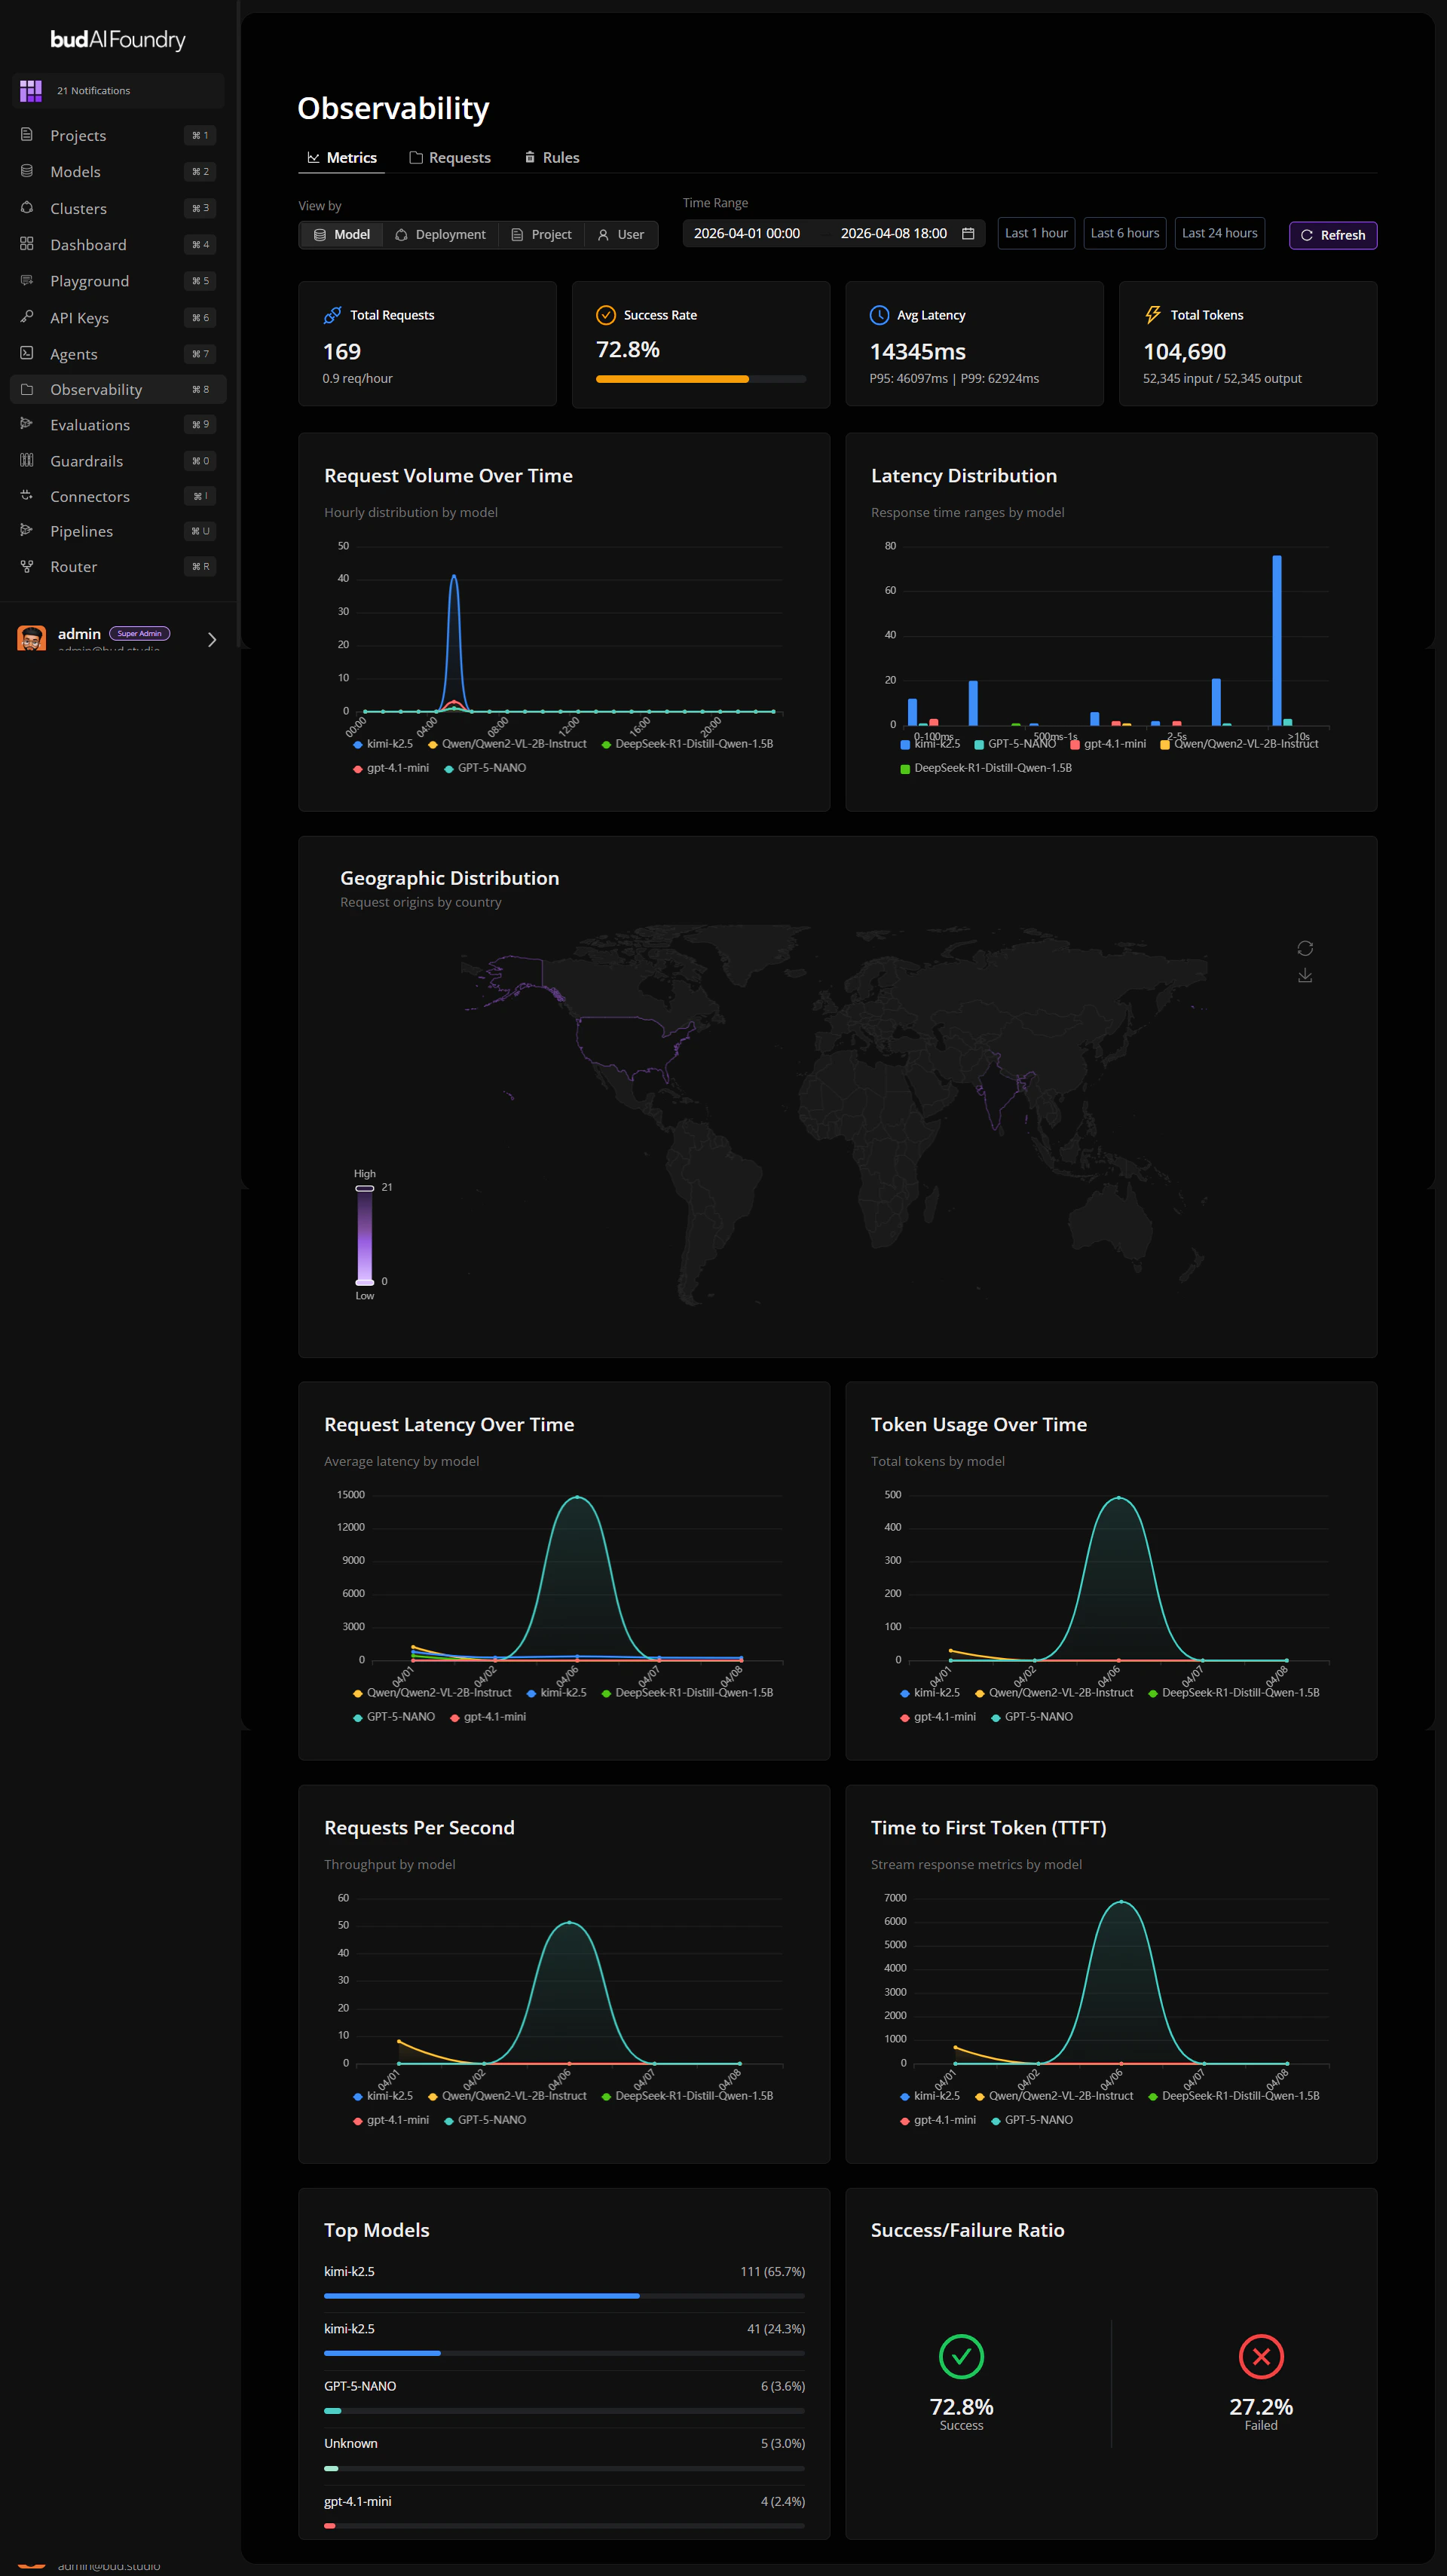
Core Workflows
- Monitor trends on the Metrics tab.
- Investigate anomalies from the Requests tab.
- Protect traffic using Rules tab controls.
- Iterate by adjusting filters and repeating analysis.
Getting Started
Quick Start
Explore metrics and requests in minutes
Observability Concepts
Learn key objects, signals, and tabs
First Investigation
Run a practical investigation flow