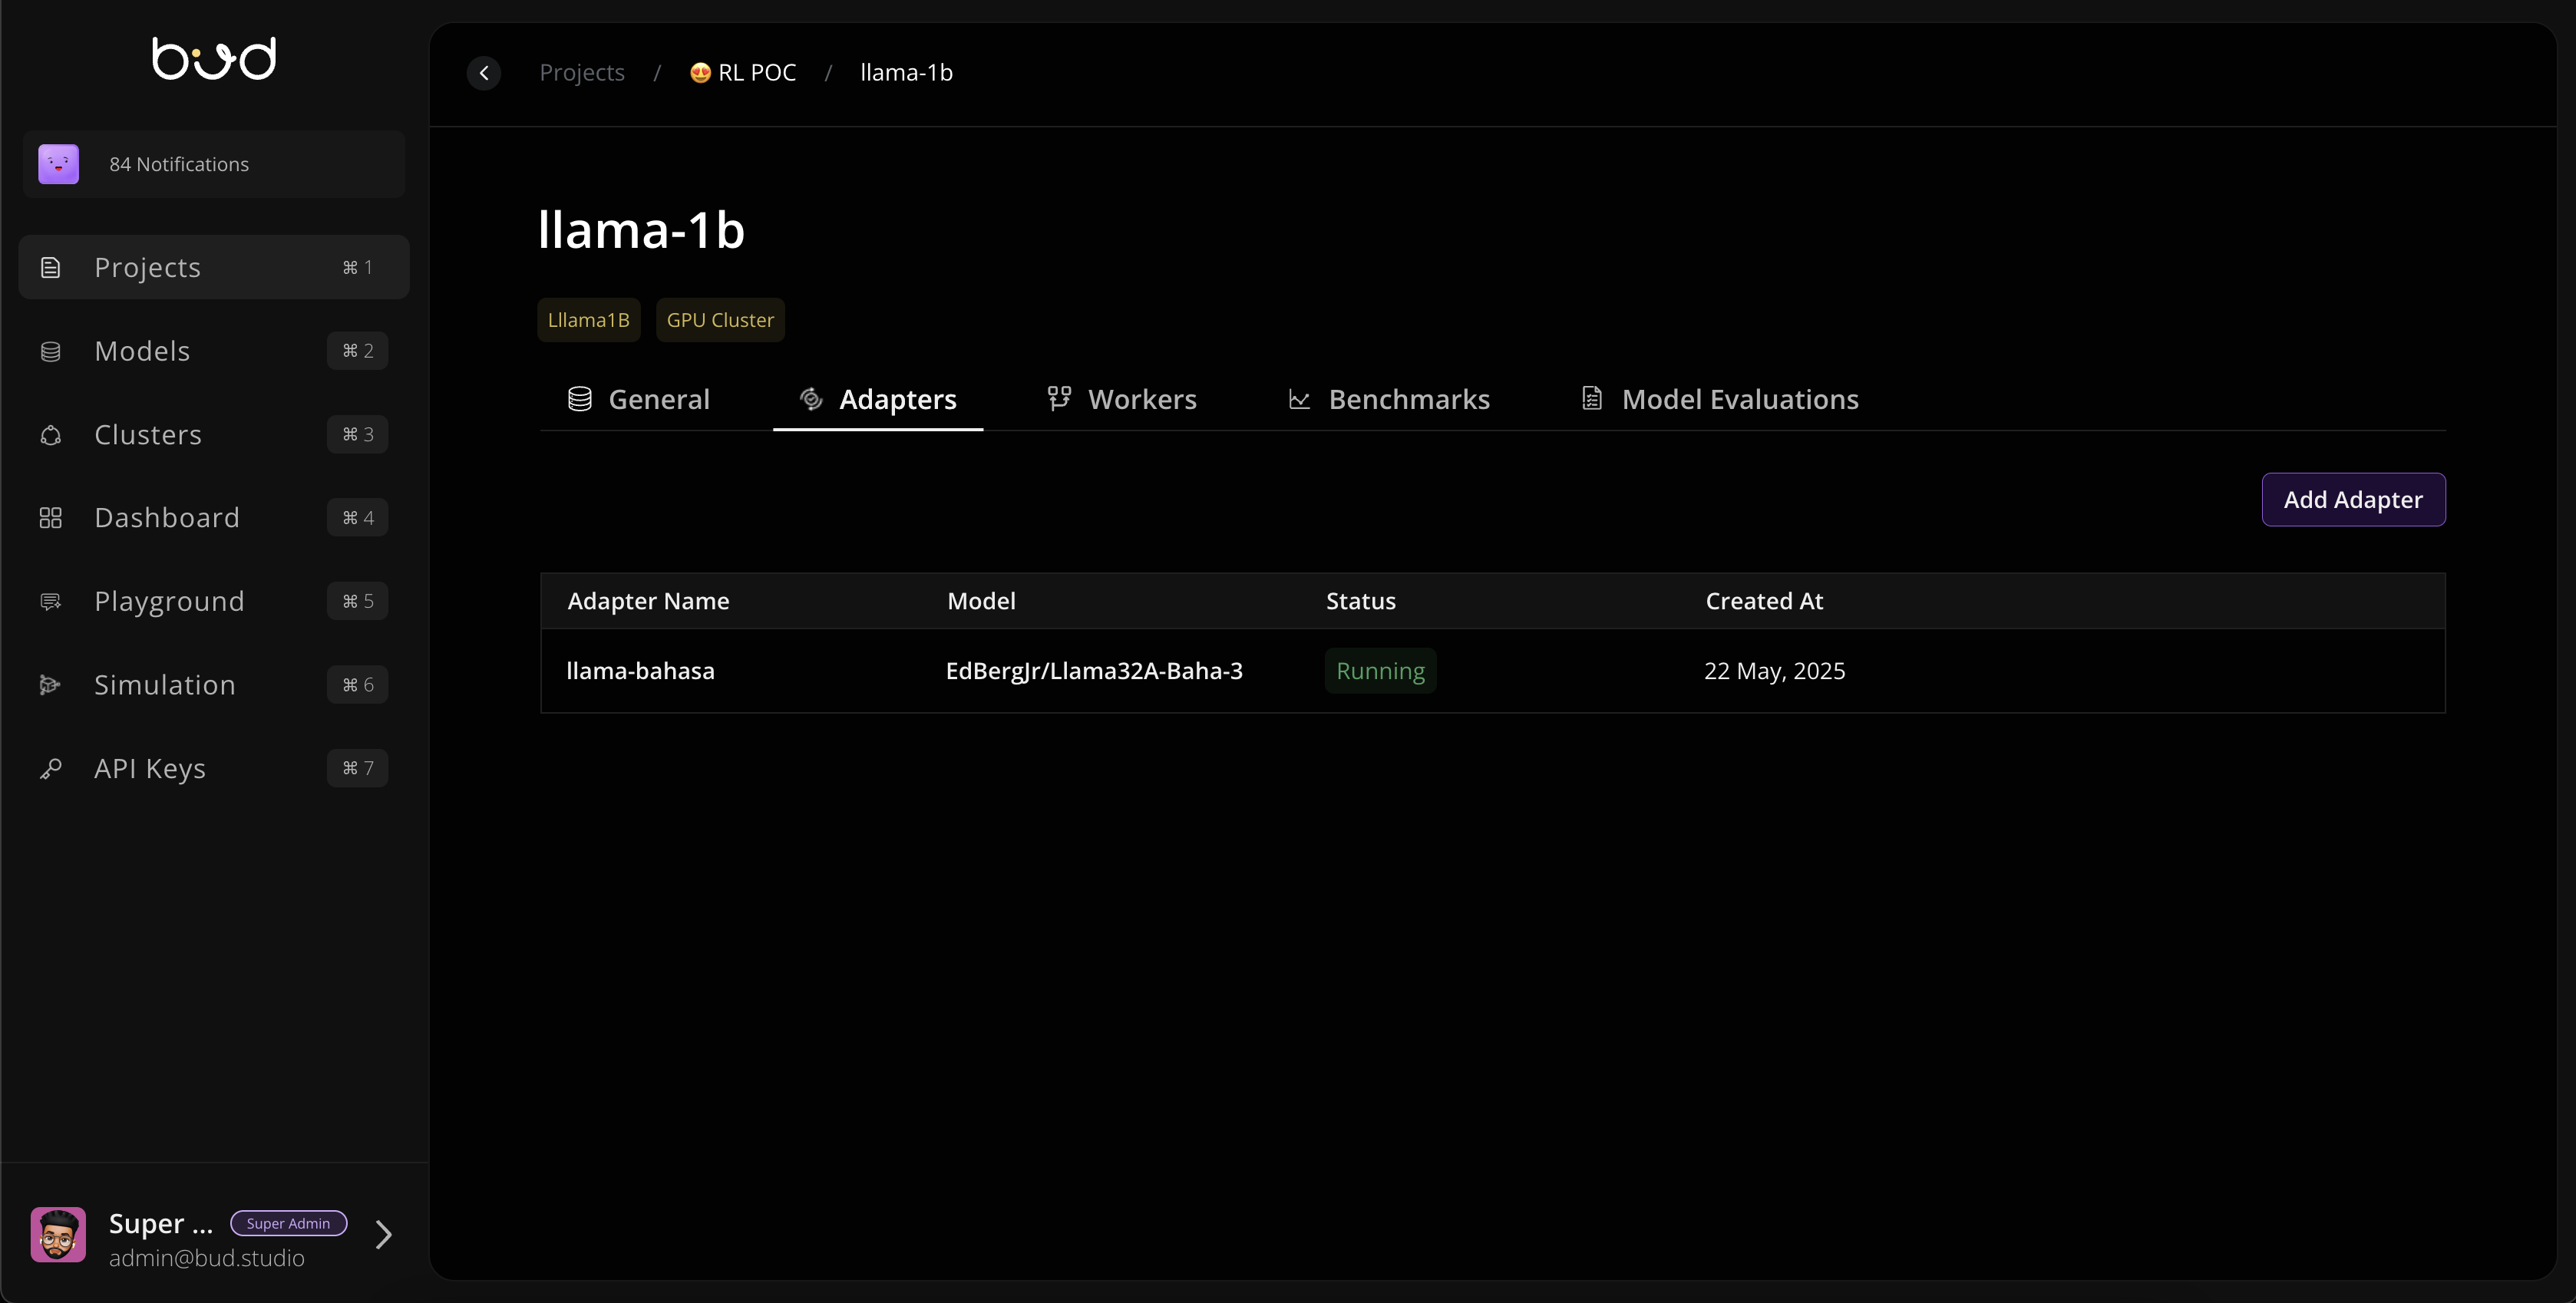
Dashboard Overview
The Bud Runtime dashboard provides a comprehensive interface for managing your AI workloads, models, and system resources.Main Navigation
Home Dashboard
The home dashboard displays:- Active model deployments
- System resource utilization
- Recent API requests
- Performance metrics
Models Section
Navigate to the Models section to:- View deployed models
- Deploy new models
- Configure model parameters
- Monitor model performance

API Management
Access API features:- Generate API keys
- View API usage statistics
- Configure rate limits
- Test endpoints
Monitoring
Real-time monitoring includes:- GPU utilization
- Memory usage
- Request latency
- Error rates

Quick Actions
Deploy a Model
- Click “Deploy Model” from the dashboard
- Select model type and version
- Configure resources
- Click “Deploy”
Scale Deployments
- Navigate to the model details
- Adjust replica count
- Apply changes
View Logs
- Select a deployment
- Click “View Logs”
- Filter by time range or severity
Search and Filters
Use the search bar to:- Find specific models
- Search API logs
- Filter deployments by status
Keyboard Shortcuts
Ctrl/Cmd + K: Quick searchCtrl/Cmd + /: Toggle helpG then M: Go to ModelsG then A: Go to API
User Settings
Access user settings to:- Configure dashboard theme
- Set notification preferences
- Manage account settings
- Export configurations
Tips for Efficient Navigation
- Use breadcrumbs to track your location
- Pin frequently used sections to the sidebar
- Customize the dashboard layout for your workflow
- Set up alerts for important events