> ## Documentation Index
> Fetch the complete documentation index at: https://docs.budecosystem.com/llms.txt
> Use this file to discover all available pages before exploring further.
# Quick Start
> Start using Dashboard in minutes to monitor health, performance, and model quality
Use this guide to run a first-pass health review using the Dashboard module.
```mermaid theme={null}
graph LR
A[Open Dashboard] --> B[Review Summary Cards]
B --> C[Set Time Filters]
C --> D[Inspect Performance Charts]
D --> E[Check Accuracy and Tokens]
E --> F[Decide Next Actions]
```
## Step 1: Open Dashboard
1. Sign in to Bud Admin.
2. Select **Dashboard** from the left navigation.
3. Confirm the landing view shows summary cards and chart panels.
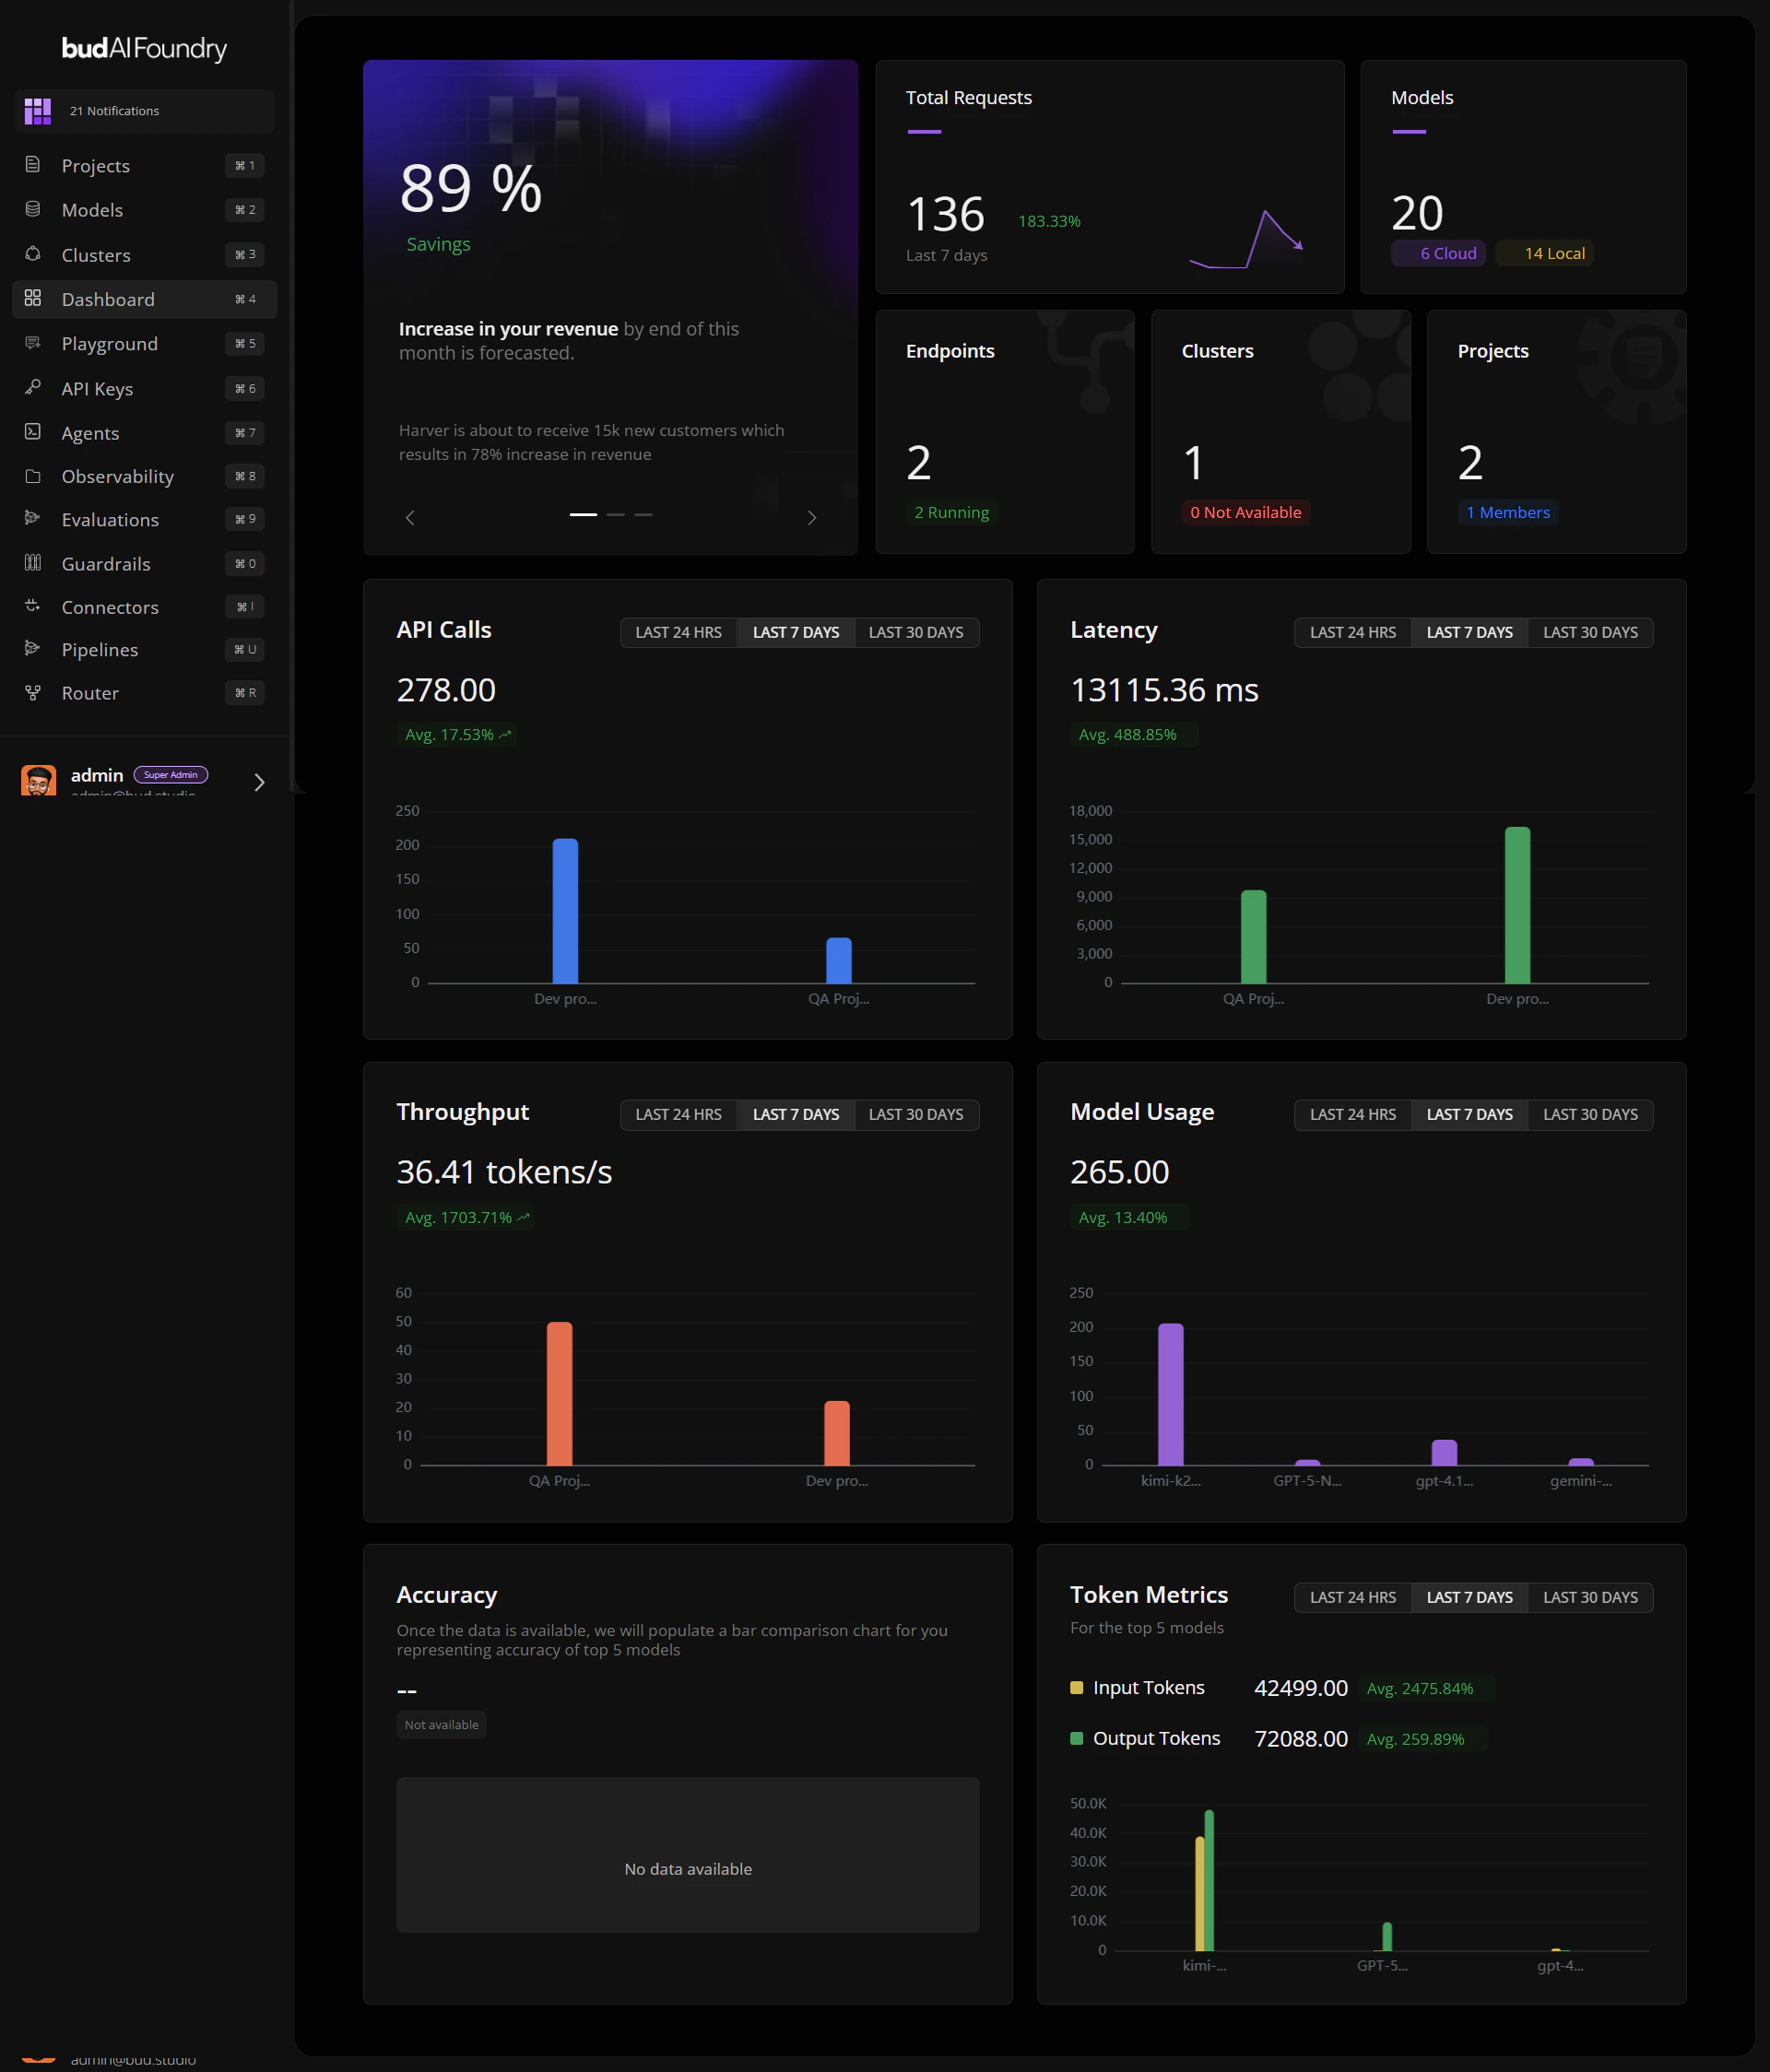 ## Step 2: Read the Top Summary Area
1. Check **Total Requests** for recent load and trend direction.
2. Check **Models** for total plus cloud/local distribution.
3. Review **Endpoints**, **Clusters**, and **Projects** cards for readiness posture.
If requests are rising while running endpoints are flat, prioritize capacity checks first.
## Step 3: Set Chart Time Windows
For each chart, pick one of:
* **LAST 24 HRS** for near-real-time anomaly checks
* **LAST 7 DAYS** for weekly trend analysis
* **LAST 30 DAYS** for capacity and planning patterns
## Step 4: Review Core Performance Charts
1. **API Calls**: identify top projects by volume.
2. **Latency**: look for regressions that may affect UX.
3. **Throughput**: verify processing efficiency at current load.
## Step 5: Review Quality and Cost Signals
1. **Model Usage**: identify the top five active models.
2. **Accuracy**: compare benchmark performance across those models.
3. **Token Metrics**: compare input vs. output token patterns.
## Step 6: Convert Signals into Actions
Typical follow-ups include:
* Scale or rebalance overloaded deployments.
* Investigate outlier projects in Observability.
* Re-evaluate low-accuracy high-usage models.
* Review token-heavy workloads for prompt optimization.
## Next Steps
Learn how metrics and deltas are interpreted
Apply dashboard data in production operations
Resolve common dashboard issues quickly
## Step 2: Read the Top Summary Area
1. Check **Total Requests** for recent load and trend direction.
2. Check **Models** for total plus cloud/local distribution.
3. Review **Endpoints**, **Clusters**, and **Projects** cards for readiness posture.
If requests are rising while running endpoints are flat, prioritize capacity checks first.
## Step 3: Set Chart Time Windows
For each chart, pick one of:
* **LAST 24 HRS** for near-real-time anomaly checks
* **LAST 7 DAYS** for weekly trend analysis
* **LAST 30 DAYS** for capacity and planning patterns
## Step 4: Review Core Performance Charts
1. **API Calls**: identify top projects by volume.
2. **Latency**: look for regressions that may affect UX.
3. **Throughput**: verify processing efficiency at current load.
## Step 5: Review Quality and Cost Signals
1. **Model Usage**: identify the top five active models.
2. **Accuracy**: compare benchmark performance across those models.
3. **Token Metrics**: compare input vs. output token patterns.
## Step 6: Convert Signals into Actions
Typical follow-ups include:
* Scale or rebalance overloaded deployments.
* Investigate outlier projects in Observability.
* Re-evaluate low-accuracy high-usage models.
* Review token-heavy workloads for prompt optimization.
## Next Steps
Learn how metrics and deltas are interpreted
Apply dashboard data in production operations
Resolve common dashboard issues quickly